Detecting snow and cloud patches in satellite images

Fredrik Olsson
Data Scientist
During the end of September this year, we participated in the Copernicus Hackathon Sweden 2020. At the hackathon - organized by Arctic Business and Innovatum Startup - all participating teams made use of satellite images through the European Copernicus project to tackle various problems related to climate change, life on land, and COVID-19.
In this blogpost, we will look at how we solved the problem of detecting snow and clouds in real world satellite images using deep learning.
The snow and cloud detection problem
The hackathon offered challenges addressing problems varying from water scarcity to automatic field delineation to COVID-19. We chose the Snow and Cloud Detection problem. The challenge here was to build models that are able to detect patches of snow and cloud in the images. Due to the similar spectral characteristics of the two, the problem of differentiating between snow and clouds in satellite image data, is quite hard.
We do not only want to know if there are snow and/or clouds in the images, but also where in the images these areas are located. The resulting problem is thus a so called image segmentation problem, where we predict a class belonging (here: snow, cloud or other) to every single pixel in the image, rather than the image as a whole.
Satellite data
For our challenge we got to make use of satellite image data of Sweden from the Sentinel-2 satellite. The data was made available through the Open Data Cube platform. In the data we could access various kinds of Sentinel-2 bands. We naturally had red, green and blue (RGB) bands, but also things like infra-red, water vapour maps, and more. Using the RGB bands we can show a couple of images over an area in northern Sweden at different times.
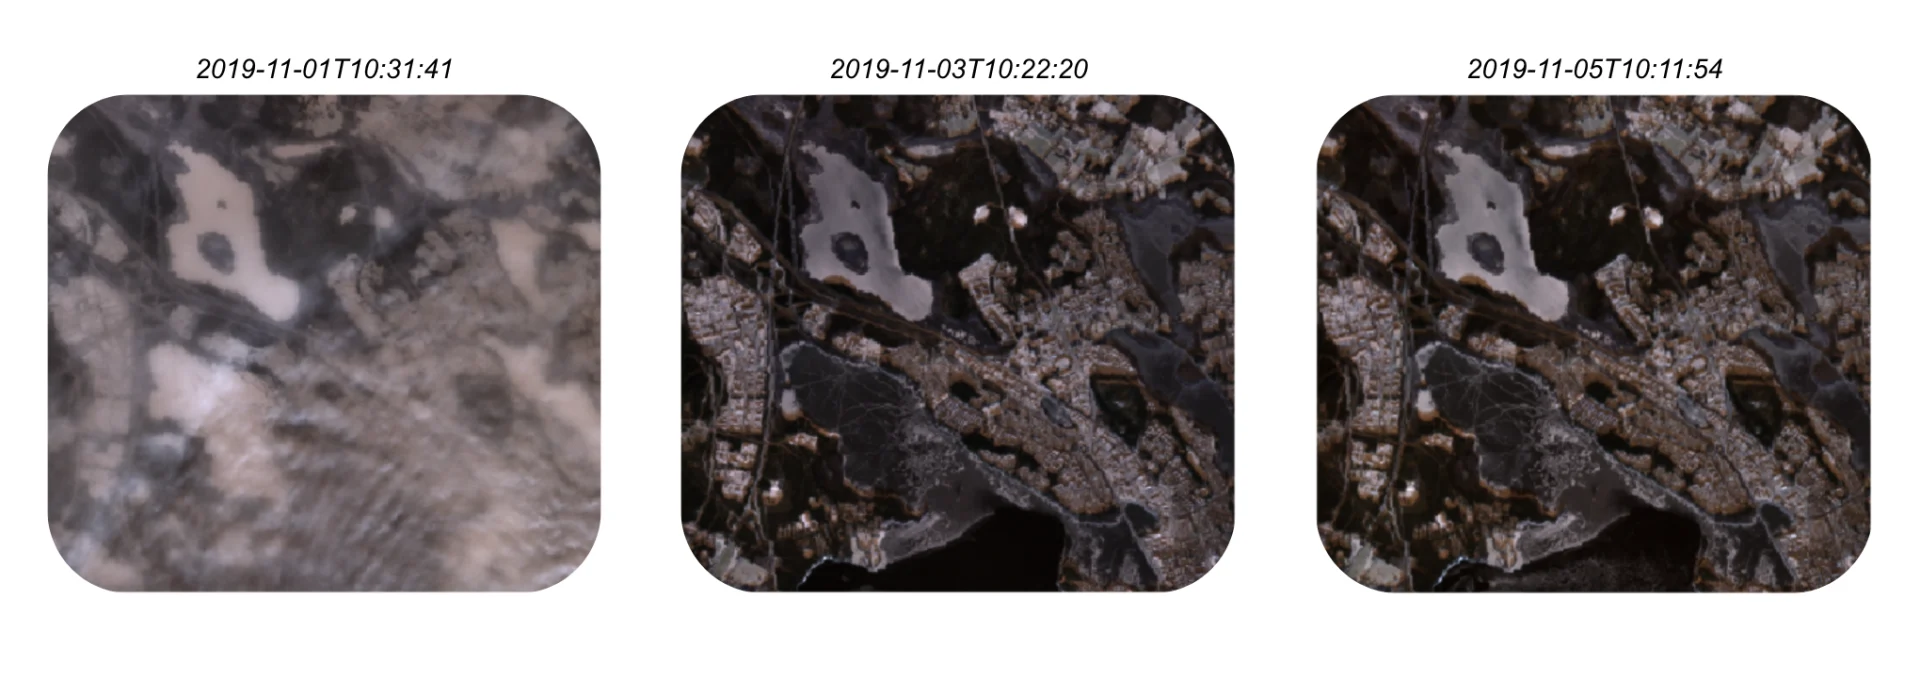 Example images from the satellite data.
By collecting a lot of such images from different areas at different times, we constructed our own dataset that was used to train and evaluate models for solving the task at hand.
K-means clustering
As no annotated data for image segmentation was directly available, our first approach was to cluster the image data using K-means clustering, since this is an unsupervised method. With three desired classes (snow, clouds and other) we tried this approach with three clusters. Let's look at some examples to get a sense of the results.
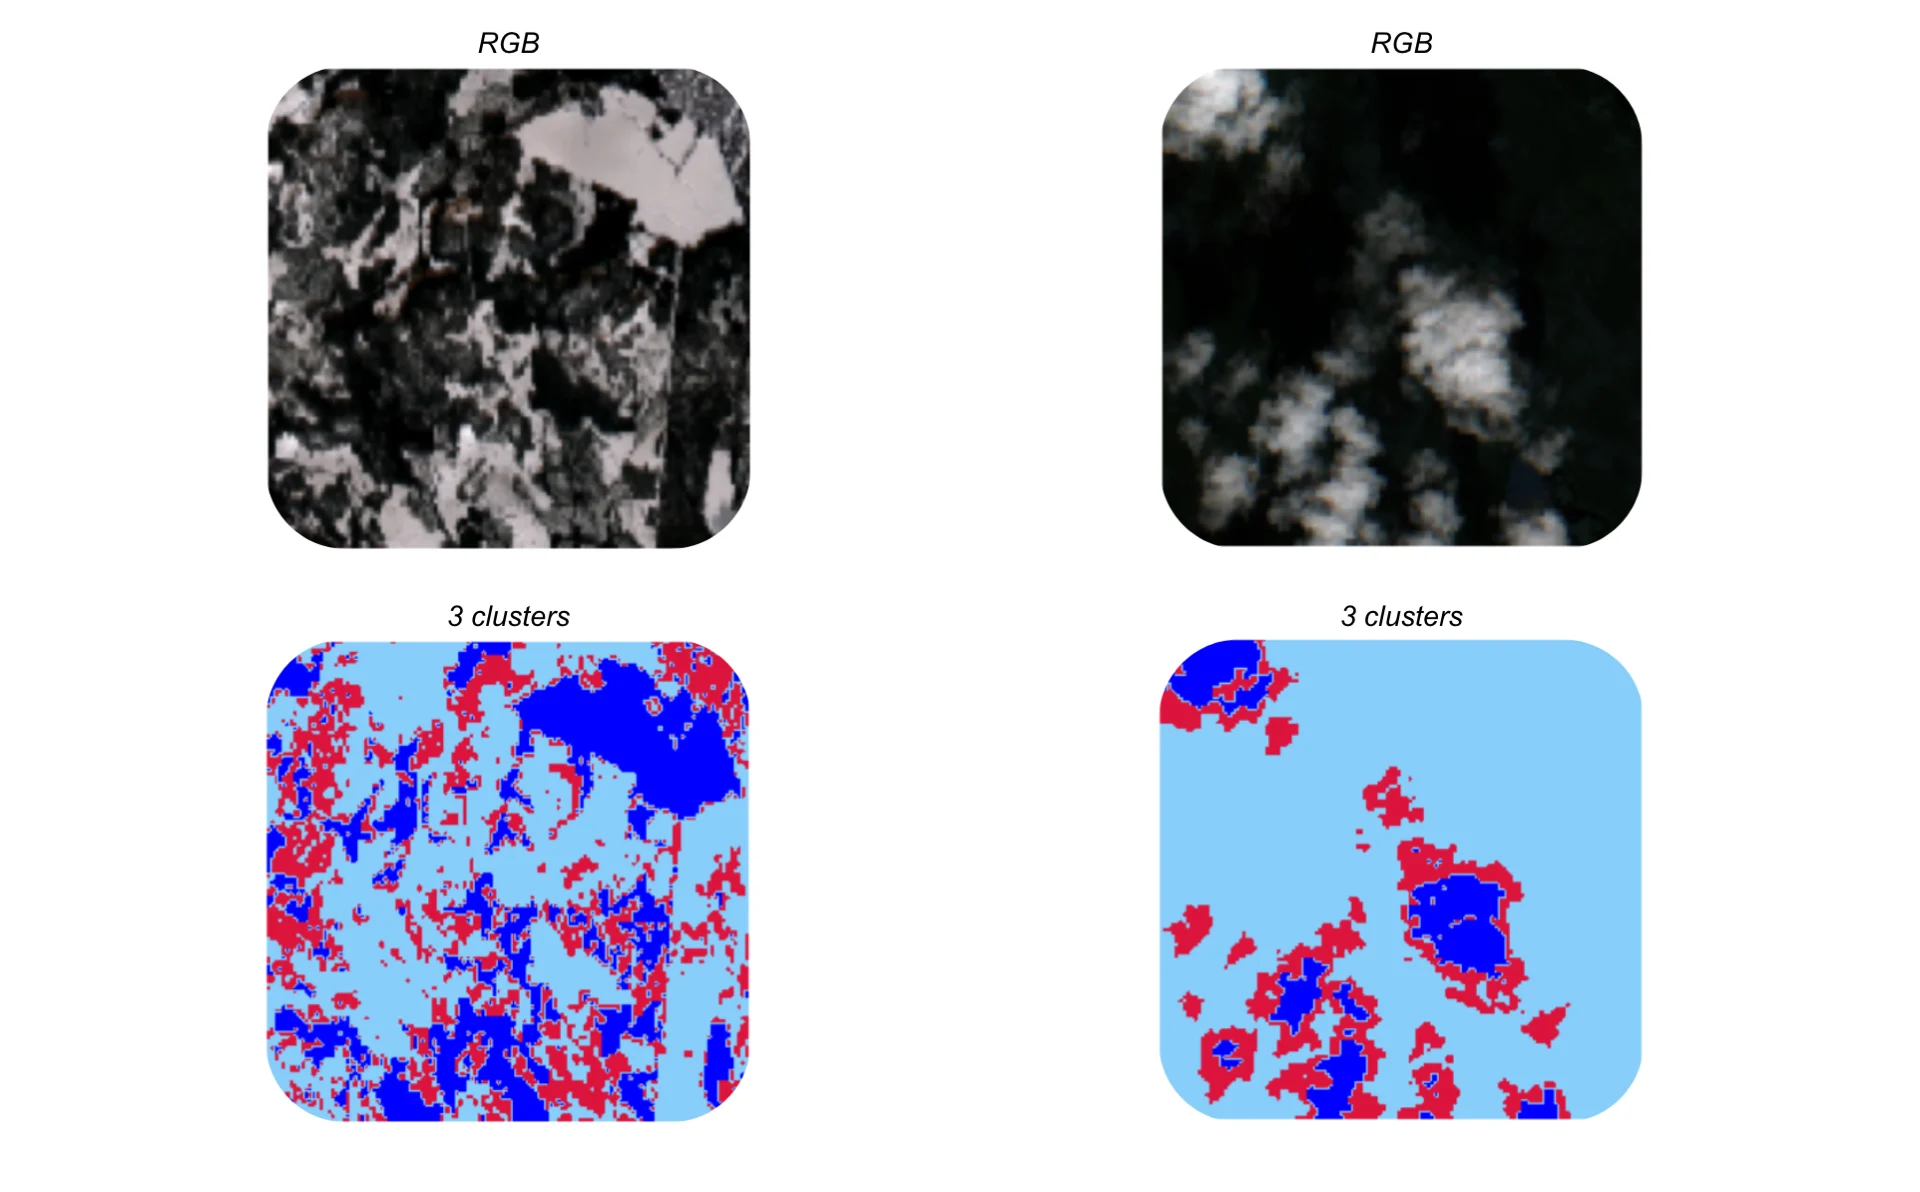 Example results from the K-means clustering.
By analyzing the clustering results, we can see that the K-means algorithm successfully separates snow and clouds from everything else. However, the algorithm is not able to discriminate between snow and clouds. As we can see, the snow and cloud patches are merged together into two clusters, rather than separated into individual ones.
The unsupervised clustering approach is clearly not sufficient for solving the problem. We will therefore instead train an image segmentation model in a supervised setting to try and solve our problem.
Image segmentation
While it is exciting to dive right into the building of a model for image segmentation, we will first look at how we created annotations for our dataset of satellite images, so we could train and evaluate our models.
Annotations
No annotated image masks (pixelwise class belongings) was directly available. Luckily, the Sentinel-2 data provided two bands that proved useful, namely the snow probability and cloud probability bands. As their names indicate, these bands consist of the probabilities for every image pixel of containing snow respective clouds, produced by their own models.
Combining the values of these bands with thresholds for the two probabilities (as well as some smoothing tricks), we were able to generate our own annotation masks to be used in supervised learning. We can see some examples below. The purple areas are snow, the green ones clouds, and the yellow areas are everything else.
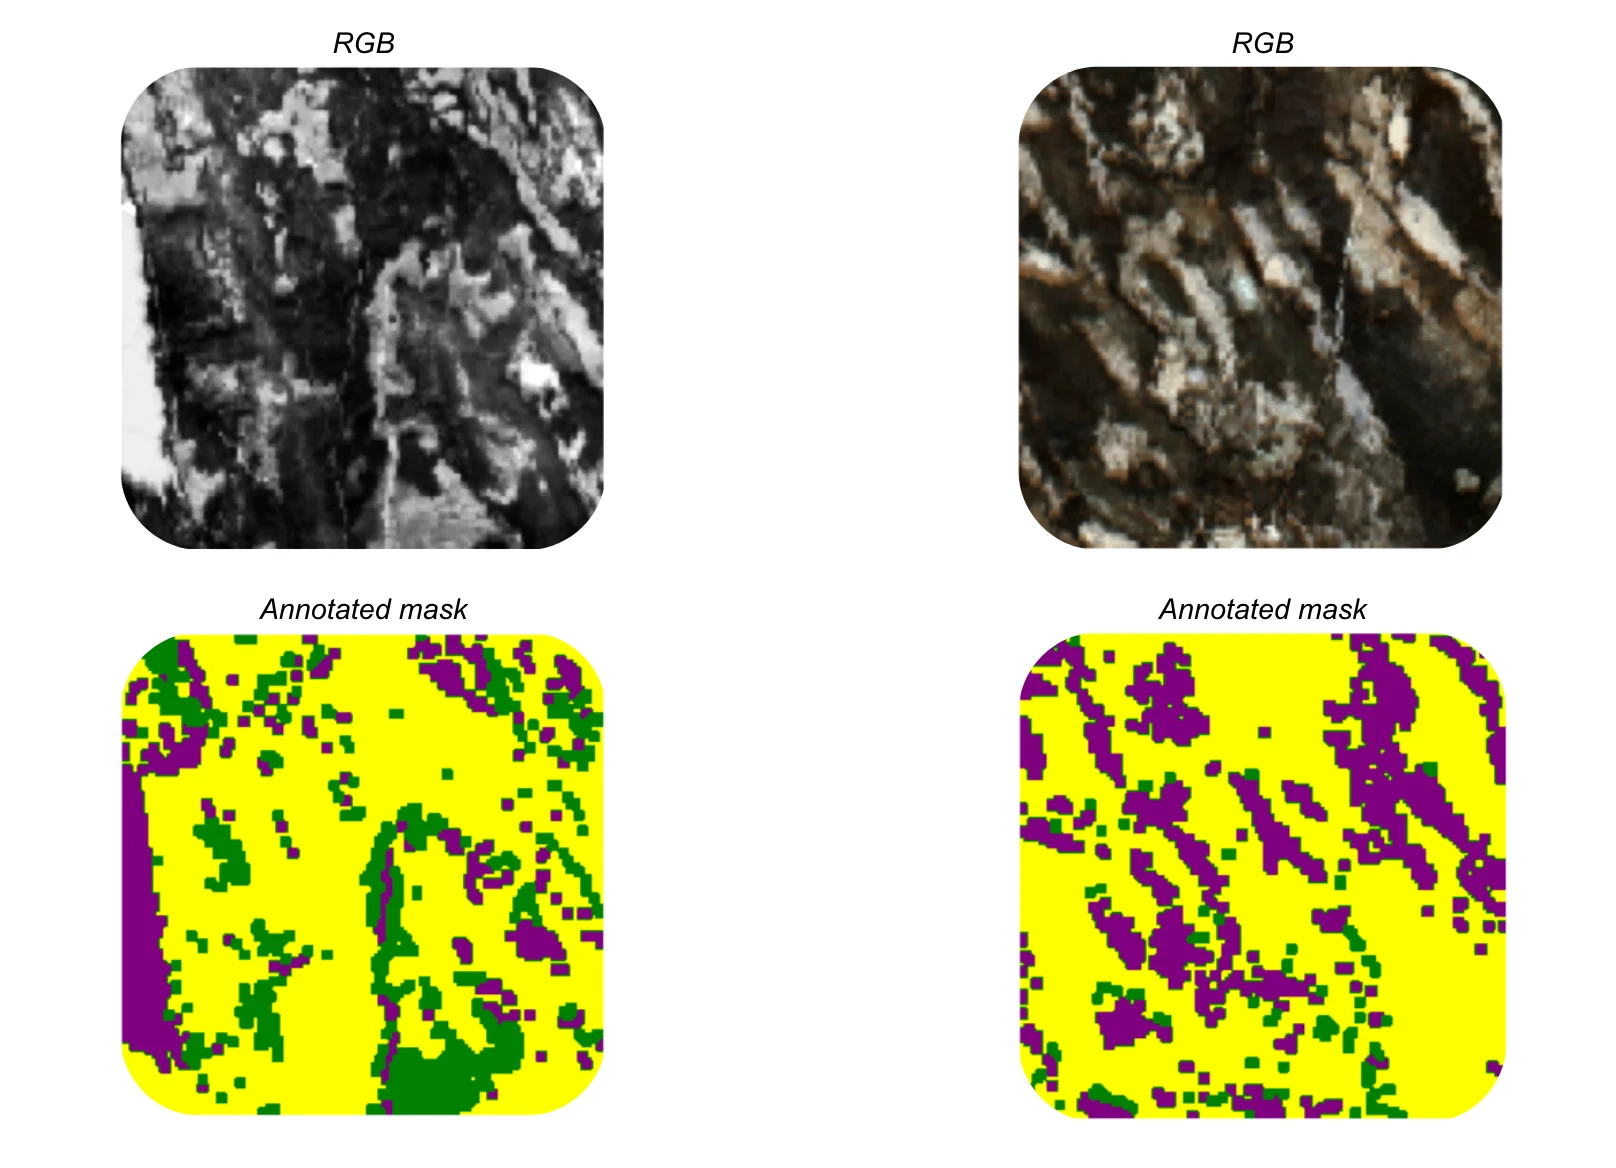 Example annotations masks for the satellite data. The purple areas are snow, the green ones clouds, and the yellow areas are everything else.
Using results from other models as annotations for your own model is of course not the preferred approach. In this case however, it was the only option going forward with supervised learning without having to annotate the images ourselves. It also provides an opportunity to improve upon the results from Sentinel-2's own models as well as giving us a model that can be used for other image data where the snow and cloud probability bands are not available.
Model
For most image analysis problems, deep learning is the way to go. Our approach to this image segmentation problem was no different. Specifically, we made use of the deep neural network U-Net structure in our model. The U-Net model is typically used for image segmentation tasks, and was actually developed for biomedical image segmentation.
The U-Net network architecture has two main parts - the downsampler and the upsampler - represented by the left respective right part in the figure below. The downsampling stack will step-by-step downsample the images as:
and by that finding good representations of the inputs that can be used by the rest of the model. This downsampling part thus work as the model's feature extractor. To boost our model, we used a pre-trained downsampling stack and as such were able to incorporate useful information from other images outside of our own dataset via transfer learning.
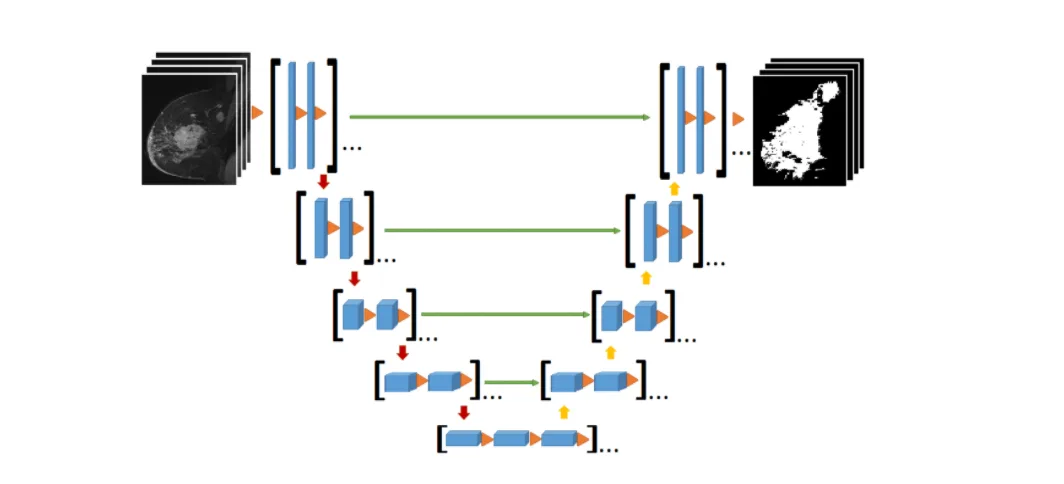 The U-Net network architecture.
The upsampler part of the U-Net model will then upsample the images again as:
before a final convolutional layer brings the images back to size 128x128.
What about those green arrows in the figure above? They symbolize so called skip-connections, which means that the model for example sends the 16x16 representations from the downsampler directly into the upsampler's 16x16 → 32x32 layer together with the output from the previous 8x8 → 16x16 layer. The skip-connections reduce the impact of vanishing gradients during training and by that speeds up and simplifies the model training.
Results
With the dataset and model in place, we only have model training and evaluation left. After splitting the full dataset into training, validation and testing sets, we trained the model for 20 epochs on the training set, and got the following learning curves:
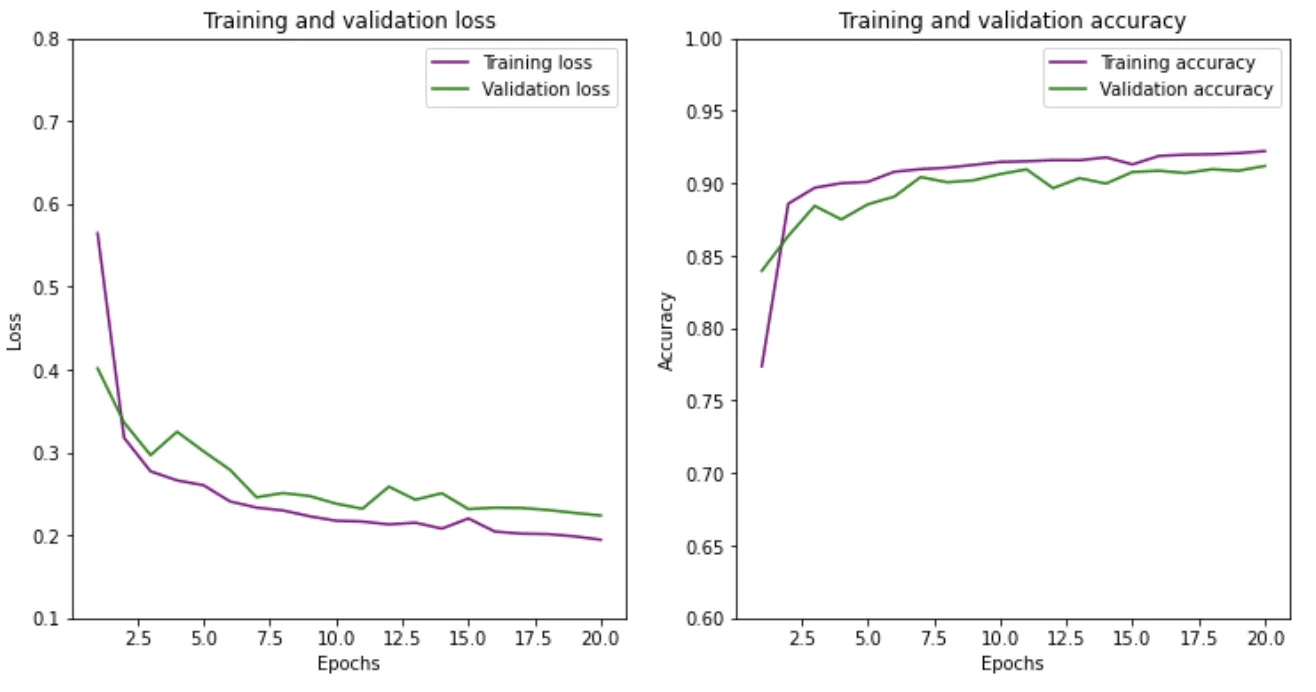 Learning curves from training and validating the model.
Apart from the "spikiness" in the curves due to a rather small dataset, all curves look as we want them to, and we are able to reach good accuracy scores. A final prediction on the test set shows an accuracy of 91% - i.e. our model predicts the correct class belonging (snow, clouds or other) for 91% of all pixels in all images in the test set, given the annotation masks we constructed earlier.
Finally, let's look at some of the predictions our model made on the test images.
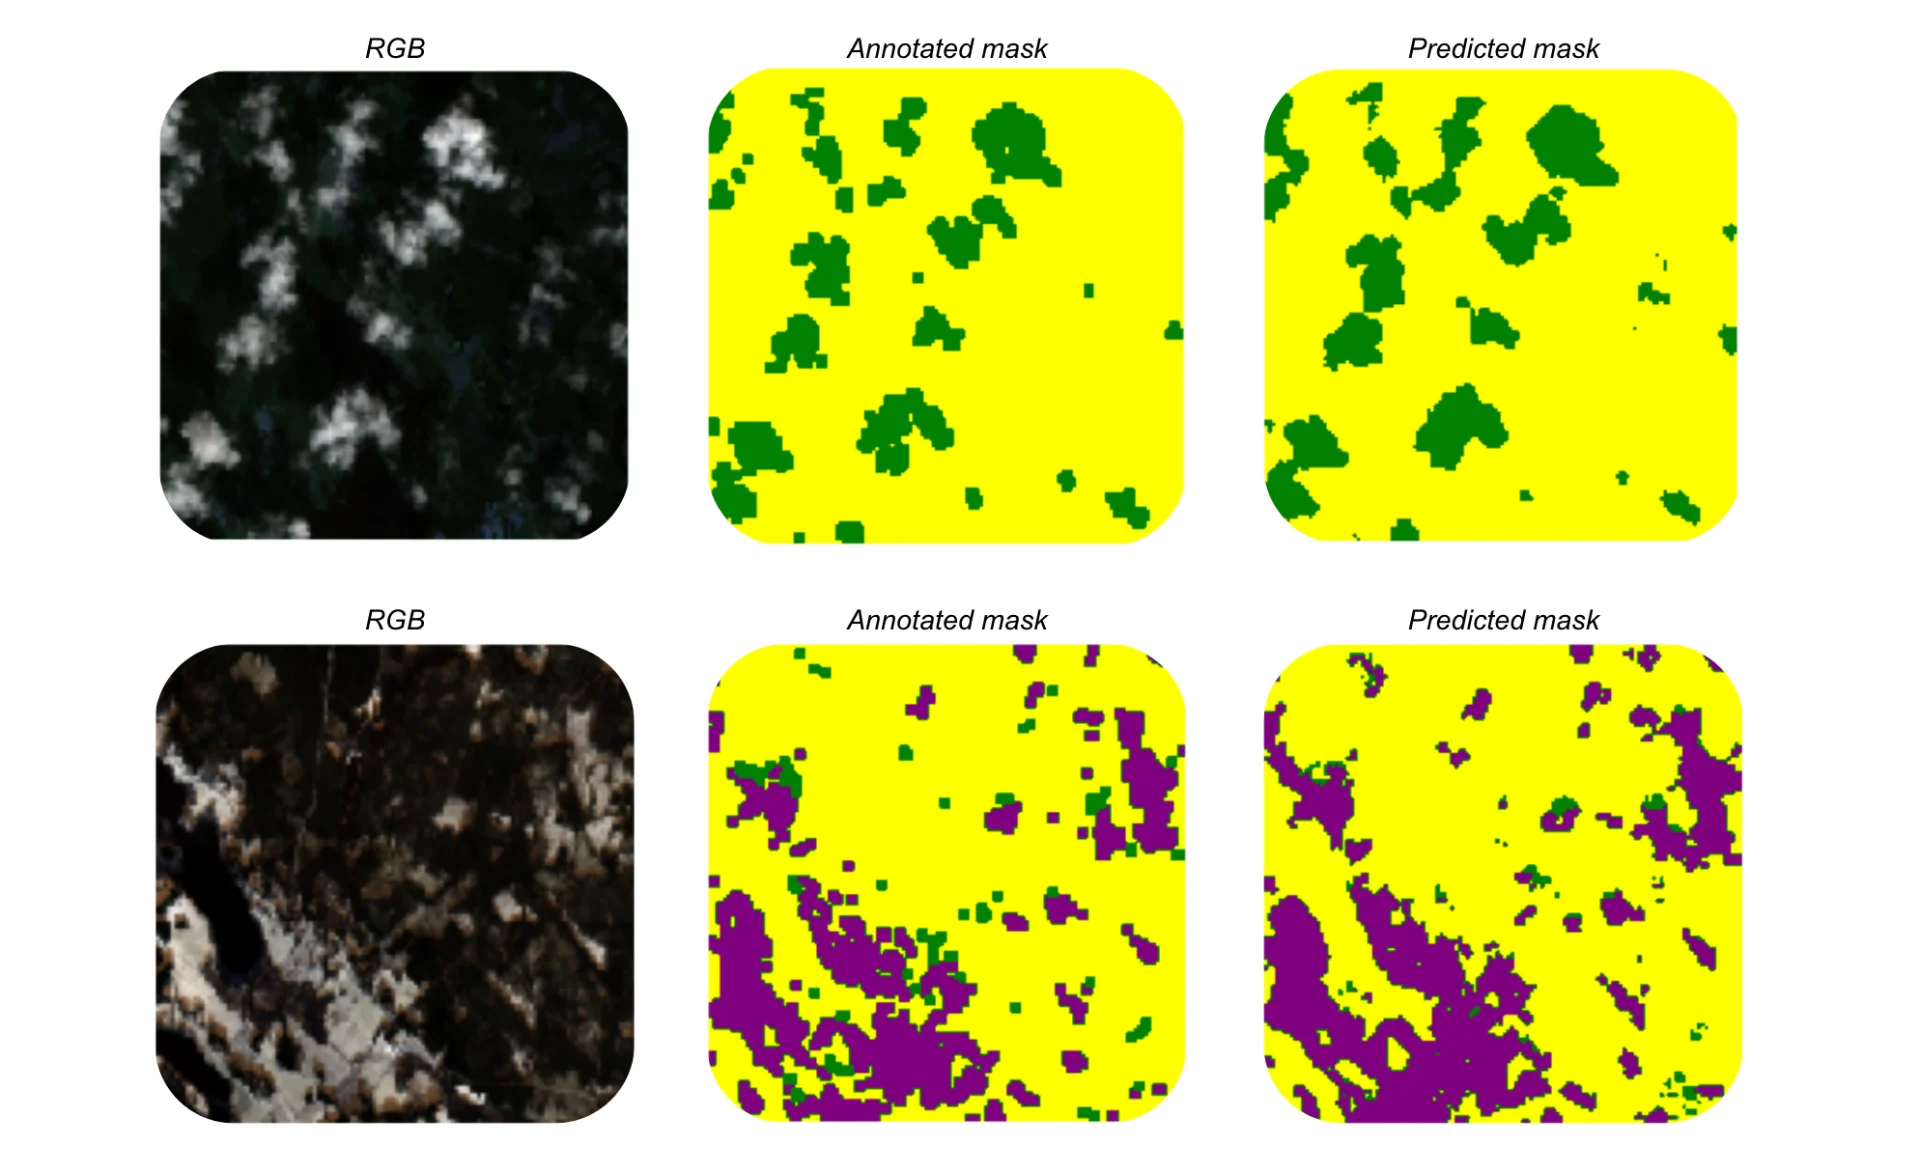 Examples of model predictions on the test set. The purple areas are snow, the green ones clouds, and the yellow areas are everything else.
Apart from the great 91% accuracy score, we can here also see that the model works really well! Unlike the clustering we did above, our image segmentation model is also able to both detect and discriminate between snow and clouds. It is also interesting to see, at least in these two examples, that the predicted masks seem slightly better than the annotated ones. Perhaps we were able to improve upon the existing Sentinel-2 models for snow and cloud detection.
Conclusion
To summarize, we tackled the challenge of detecting snow and cloud patches in satellite images from the Sentinel-2 satellite in the Copernicus project. After realizing that the unsupervised clustering approach was insufficient in solving this image segmentation problem, we annotated and trained our own U-Net neural network model, and achieved really good results.
To further improve on the results, we could:
use a larger dataset of satellite images
provide better and possibly human-made annotations
find other pre-trained models to incorporate into our own model
Overall, it was a successful and interesting project!
Further reading
In this article by AI Sweden, you can read more about our idea to use the model for snow and cloud detection to map up and forecast road conditions.
Published on December 7th 2020
Last updated on March 1st 2023, 11:06
Fredrik Olsson
Data Scientist