Göteborgsvarvet Part 3 - Finish time prediction

Oskar Handmark
Founder & Venture lead
This is part 3 in the educational finish time prediction series:
Part 3 - Runner finish time prediction (you are here)
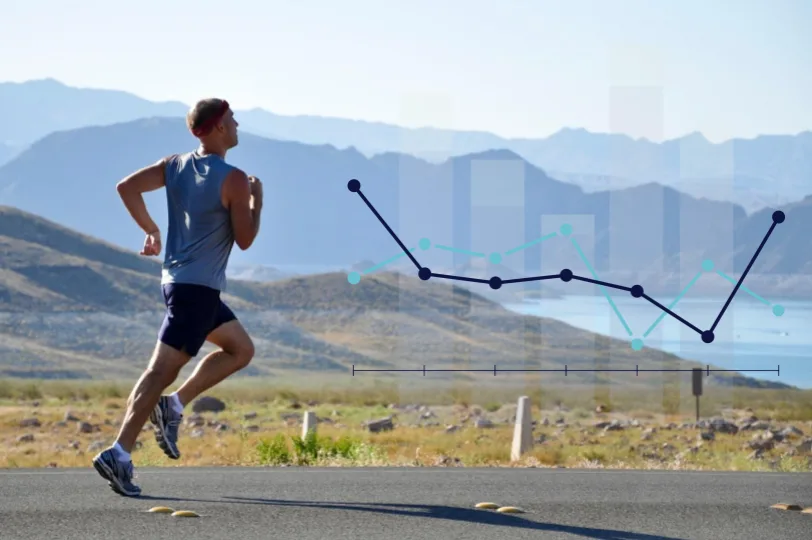
In this post, I will you show you how I managed to predict my own finish time (1:40:34) with less than 45 seconds error, before the race even started. We will use some of our findings from the first parts to:
Implement features for our model
Train 5 different models to predict finish times at each checkpoint in the race
Evaluate our results
Why we need machine learning
In part 2, we concluded that average values for metrics about runners can be used to give rough estimates of their finish times. The predictions get better as we use more metrics (features) to group by - the predictions improve if we use averages of all 28 year old men in start group 5 compared to just looking at all men of age 28.
However, as we add more metrics to group by (say we add country, city and pace for the first leg), the amount of runners in each group decreases to a point where there might be just one runner left in a group. As an example:
How many 28 year old men from Lund running the first 5km in exactly 23:20 do you think there are?
Just one.
Machine Learning
In machine learning, we combine all features in multidimensional space and fit a function to our data points. We call this function a model. During the training phase, the model learns from each data point (a runner) which is represented by features (e.g age, gender etc) to estimate a target variable (finish time). How the model learns depends on the training algorithm.
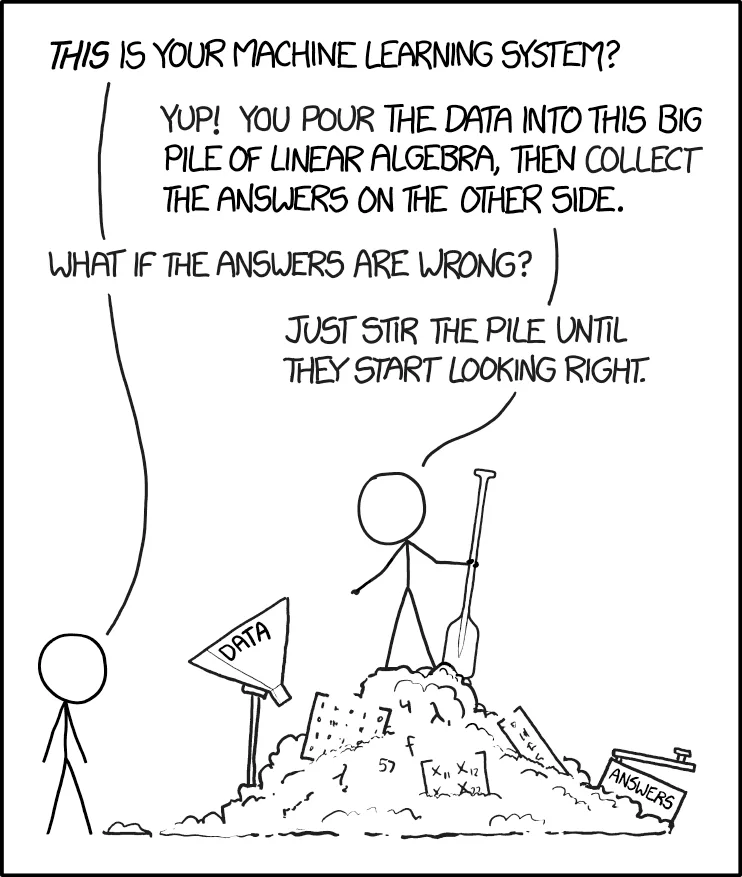 Data is information about runners. The answers are runners' finish times. Stirring is the machine learning algorithm. We stir until we can no longer improve the mean error of predictions.
Training plan
Our data set is split into a training set (80% of runners) and a test set (20% of runners). Instead of splitting randomly, we split it so that there is a fair proportion of runners from every start group in each set. The model is trained on the training set, and then evaluated on the test set. Predictions from the model are finish times for runners.
 Predictions from the test set are used to evaluate the performance of our model.
I trained five models to simulate reality as more information becomes available at each checkpoint in the race. See below.
 More information becomes available as runners progress throughout the race. We use incrementally more features and train five different models - one for each checkpoint.
Note that this type of training (only using data from the current year) is not possible in a real world scenario. It requires the training set runners to run the race before we can make predictions on the test set. Ideally, we would have had historical data for training and then test the model on the most recent race. We could of course train on all of the data and make predictions for the next year, as soon as the registration data becomes available - but doing so gives us no way to evaluate the models actual performance today.
Prediction Error & Baseline
A prediction is a runner's estimated finish time.
To evaluate the accuracy of predictions given by the model, we'll compare finish time predictions with actual finish times for every runner in the test set. For example, if a prediction for a specific runner was 2:00:00, but the runner actually finished in 1:59:00, the error is 60 seconds. However, to make things less static, a percentage based metric will be used instead of absolute numbers. In this example, the error would be 0.84%.
The mean error is computed as MAPE (mean absolute percentage error) for all runners in our test set. We can get sense of how good our model is by comparing it with the mean error of a baseline:
Baseline: Prediction using projected average pace.
This is the default prediction method used for spectators during races. It is computed by taking the runner's average pace so far, and multiplying it with the total distance.
Our goal is to beat the baseline, and have a smaller average error.
Features
General Features
Feature | Description |
|---|---|
Gender | Male | Female |
Age | Age in years |
Age group | Age group in 5 year buckets |
Start number | Relevant if seeded, otherwise in order of registration |
Start group | Runners can use their finish time from the previous two years or run a 10km pre-race to qualify for a start group. |
Company | Represented company |
City | Represented city |
Country | Represented country |
5 km pace features
Pace features. Available as the runners crosses the 5 km checkpoint.
Feature | Description |
|---|---|
5 km time | 5 km leg time, in seconds |
5 km pace | 5 km leg pace, in seconds / kilometer |
Start group relative pace | Pace relative to average pace of training set runners in the same start group |
Age group relative pace | Pace relative to average pace of training set runners in the same age grou |
Gender relative pace | Pace relative to average pace of training set runners of the same gender |
Start group + age relative pace | Pace relative to average pace of other runners of the same start group + age group combination |
Start group + gender relative pace | Pace relative to average pace of other runners of the same start group + gender combination |
Gender + age relative pace | Pace relative to average pace of other runners of the same gender + age group combination |
10, 15, 20 km pace features
Same as above, but for 10, 15 and 20 km respectively. We also add a feature that compares runners' pace profiles to an average elite runner's profile. This feature requires at least two pace data points (e.g 5km and 10km), and is used as a similarity score between the runner and an elite runner.
Feature | Description |
|---|---|
Elite runner pace profile similarity | The pace percentage difference for the 5k and 10k checkpoints of the top 20 runners for both genders are computed. These values are compared to the current runner's pace percentage difference and used as a similarity score. |
Training
Using the features above and a machine learning algorithm called RidgeRegression we train the model, teaching it to minimize the MSE (mean squared error) of the datapoints in multidimensional space against our target variable; finish time.
Why did I use RidgeRegression? Well, it's fast to train, doesn't require a lot of hyper parameters and, it worked. Given the timeframe (1 week at Codecation I had for this project, I needed fast iterations to be able to fix errors and try out new features. I tried a few different other models, and found RidgeRegression to be superior. We let our trained model run predictions on our test set, which wasn't used for training, and get the following results:
Individual results
Before we look at average results, let's see what the model predicts for my individual results, to give you a sense of what role every model plays.
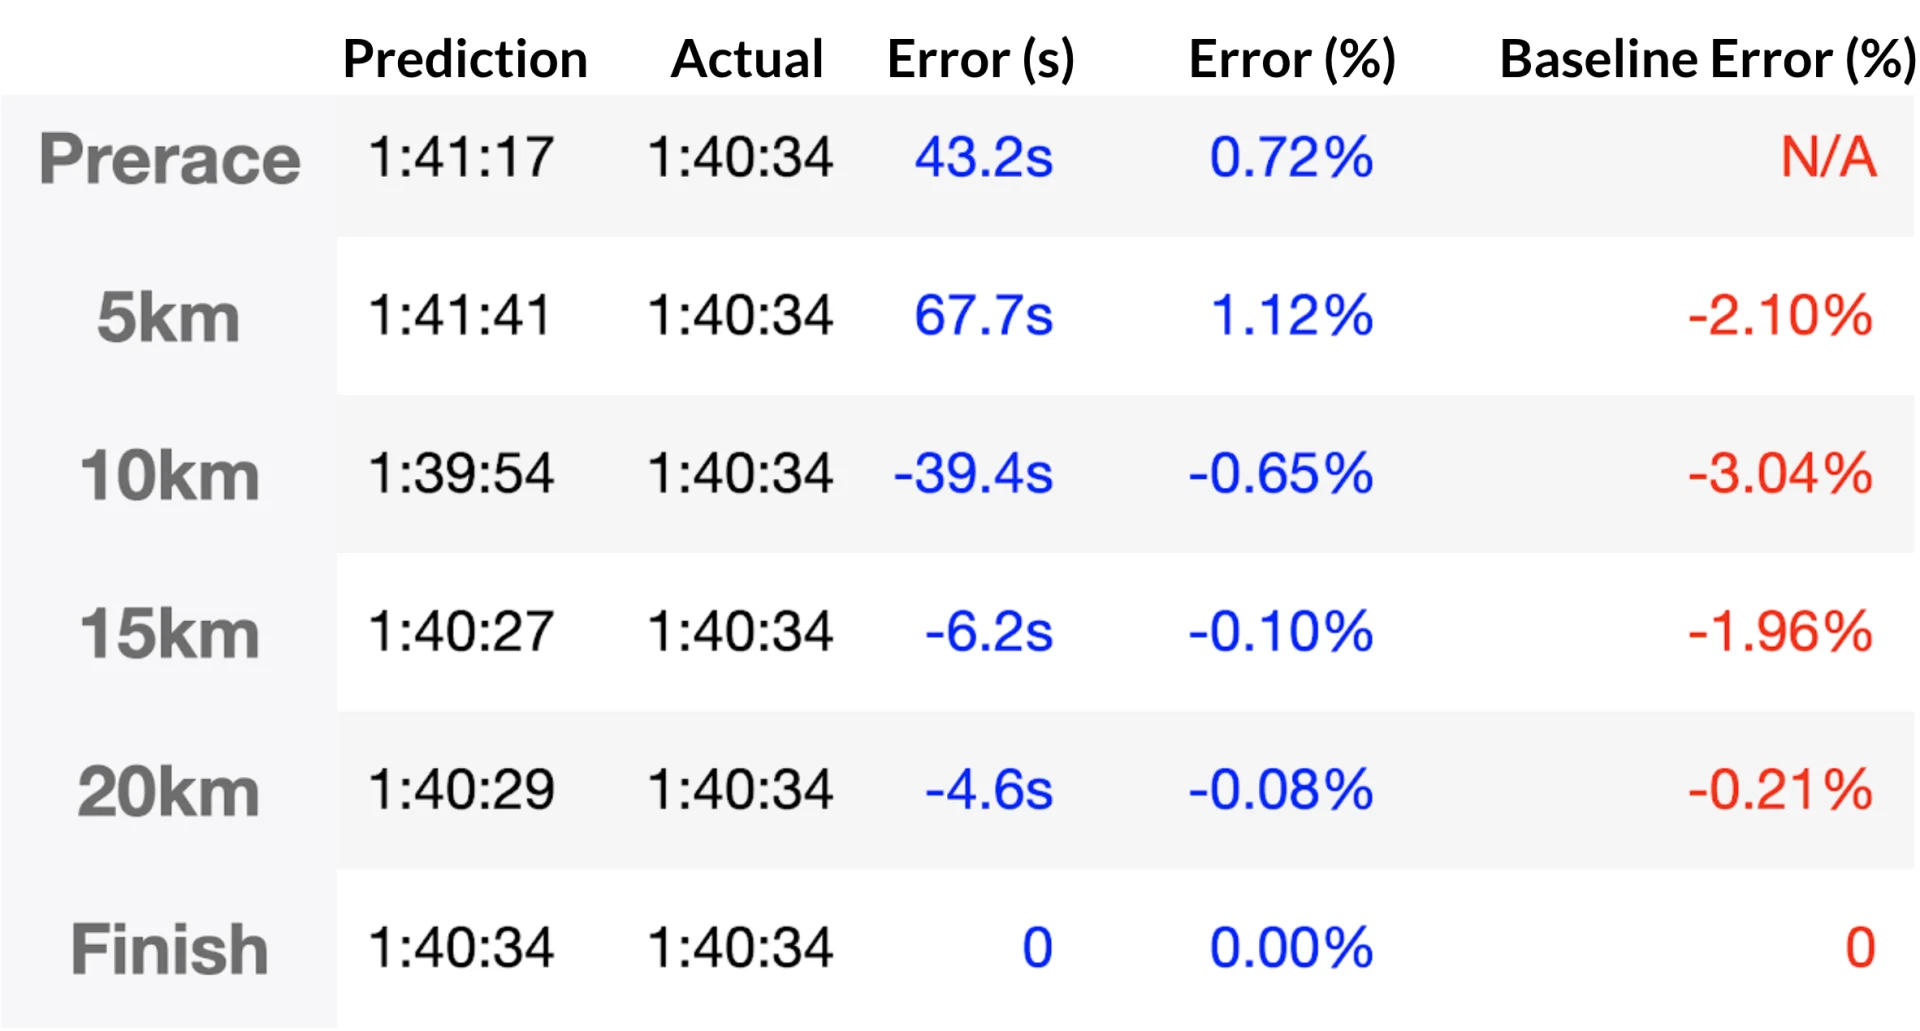 Individual prediction results for Author. Our model outperforms the baseline (projected average pace) in all cases.
Results
Results for all runners in the test set:
Checkpoint | Baseline Error | Our Model's Error | Improvement |
|---|---|---|---|
Prerace | - | 7.8% | ∞ |
5 km | 5.44% | 3.89% | 28.5% |
10 km | 4.47% | 2.18% | 51.2% |
15 km | 2.33% | 1.10% | 52.8% |
20 km | 0.29% | 0.21% | 27.6% |
We manage to improve the mean absolute percentage error by over 50% for predictions made at the 10 and 15 km checkpoints! Our model's error is largest for predictions before the race, which makes sense since we have less information to use at that point. The baseline is not capable of doing a pre-race prediction, so we consider that an improvement of infinity percent. Below boxenplot also shows median (middle line), quartiles (box top/bottom) and (min/max) (whiskers):
 Error for test set. Our trained model (blue), outperforms the baseline at all stages. The improvement is most significant at checkpoints 10 and 15 km.
Improvements
Historical Data would allow us to follow returning runners over multiple years and learn from their previous races. It would also allow us follow the entire population and learn from trend shifts in running. As the years go by, have we managed to educate the running population around hubris and whats the trajectory of the effect?
Other sources of data, like GPS-watch data & Strava/Garmin history would allow us to follow a runner's training and use results from previous workouts as features to our model.
Higher resolution data such as a checkpoint time every kilometer instead of every five kilometers. It would allow our models to deliver fresh predictions more often and monitor hubris and pace changes more closely.
Learnings
Running with a watch helps you pace yourself during the race.
Set goals! Although being a physical sport, there's a lot of psychology in running.
Look at your own data! Learn from it.
Consider your age, gender and your hubris risk. Be aware of the fact that the effect of hubris is largest for young and old runners!
Plan your race! Look at elite runner pace profiles and try to run similarly. Set your goal and backwards-calculate what checkpoint times you should aim for.
A short note on the future of running
An interesting thought is to consider a situation where we can run these models on our watches, and get predictions every seconds, right on our arm. The technology to do this exists today, and I'm excited to see what comes next. At the same time, it's a scary thought - it would almost be like a cheat, having a device that tells you in real time if you are running too fast or too slow relative to your capabilities. Either way I think it will develop the sport, and serve as a way to educate the runner population about themselves.
What's next
There are primarily three things I want to do next. Community interest make these possible. Let me know what you'd like to see next.
Race Planning UI. Based on my findings in this blog series, it should be trivial to create a small UI where runners can enter their details & finish time goals, and receive personalized tips and suggested pace profiles. With API integrations to time tracking software, real time predictions can be made visual in the UI.
Historical data. Incorporating 20 years data from Göteborgsvarvet should improve the results a lot. I'm curious how close we can get to perfect performance for runners that participated over multiple years.
Give this to the world. Improving the spectator experience is trivial by adding a smarter finish time predictor (like this one). I know some companies are doing this already, but if you know somebody who might be interested, contact me at oskar@backtick.se.
Published on February 24th 2020
Last updated on March 1st 2023, 11:00

Oskar Handmark
Founder & Venture lead