Göteborgsvarvet Part 2 - Pace analysis and feature engineering

Oskar Handmark
Founder & Venture lead
This is part 2 in the finish time prediction series:
Part 1 - Data analysis What can we learn by just looking at the data from different angles?
Part 2 - Hubris analysis (you are here)
Part 3 - Runner finish time prediction
In this post we will dive into pace analysis to see if we can understand the runners even further.
Let's pick up where we left off:
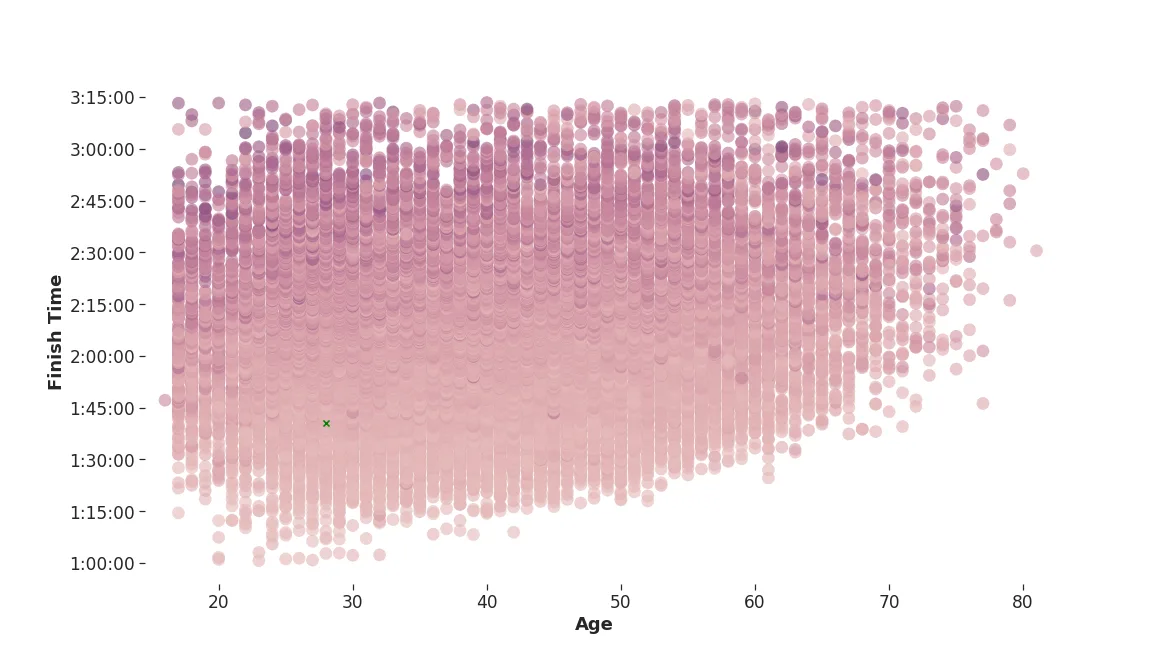 Standard deviation of run pace for the five different checkpoints computed individually for each runner. Darker means a more uneven pace. One circle per runner.
Because this standard deviation is computed for each runner individually, it gives a fair value of how much you vary your pace relative to yourself. It is clear that it is advantageous to keep an even pace.
That green cross? That's me, and while I can get any younger, there’s certainly room for improvement by moving further down to the right on the chart. Doing analyses like this is especially fun when you can find yourself in the data, and learn how you can improve.
Let's look further at how runners vary their pace, and if there are difference between men, women, and different age groups:
 Pace profiles for each split, calculated as the percentage difference between the pace for each split from the runner's pace for the entire race. Women keep a slightly more even pace than men.
Previous studies in gender differences in marathon pacing show that men overestimate themselves more than women. However, results shown in the above plot are not as significant as presented by J.Hubble and J.Zhao. This is in accordance with research of the Ljubljana marathon and half marathon finish times - gender differences for half marathons are less significant than for regular marathons.
Hubris Analysis
What does overestimate mean?
Is it correct to define overestimation as pace loss in the pace profile of the entire race, as suggested by the research available today? Probably, but I will suggest another metric that might give some further insights and is a bit more applicable to our machine learning model: hubris.
Lets define hubris as a runner's pace loss relative to their initial pace (the first 5 kilometers).
Percentage pace difference relative to starting pace by gender
 Percentage difference between pace for a specific leg and the pace for the first leg. For example, between kilometer 10-15, men and women held around 8% slower pace compared to the first 5k, on average.
Indeed, men seem to burn out more than women do in the later stages of the race, but women drop more in pace between kilometer 5-10 and 10-15 compared to their opening pace. Which gender has the most hubris?
If we look at the individual splits, it is clear that women have the most hubris in the earlier stages of the race. However, if we consider the plot as a whole, it could suggest that:
Men try harder to keep their opening pace, but suffer a larger pace reduction in the later stages of the race.
Women slow down more than men after realizing they opened to fast - leading to a more stable pace.
Let us see if age groups show the same effect:
Percentage pace difference relative to starting pace
 Percentage difference (calculated as above, but per age group). Young and old runners have the most hubris.
A similar effect is visible here, but only for the last kilometer of the race.
Because we cannot observe the same effect for age groups as we did for men and women between the first and second half of the race, the pace adjustment effect seems to be gender specific.
Remember that these are averages for gender and age groups independently, and while men generally overestimate themselves more than women, it does not have to be true for specific gender and age group combinations.
As a simplified single metric of hubris, we compute the average pace loss between kilometer 5 and 20, relative to the first 5 kilometers.
Average pace loss for km 5-20, compared to initial pace
 Average hubris for kilometer 5-20. It is clear that age is more significant when it comes to comparing age and gender groups, for this race. The difference between genders is barely noticeable.
Why are we doing this?
We're trying to understand what, why and how metrics interact with each other. This helps us create mathematical concepts of our data to better predict what time a specific runner will finish at.
Hubris versus finish time
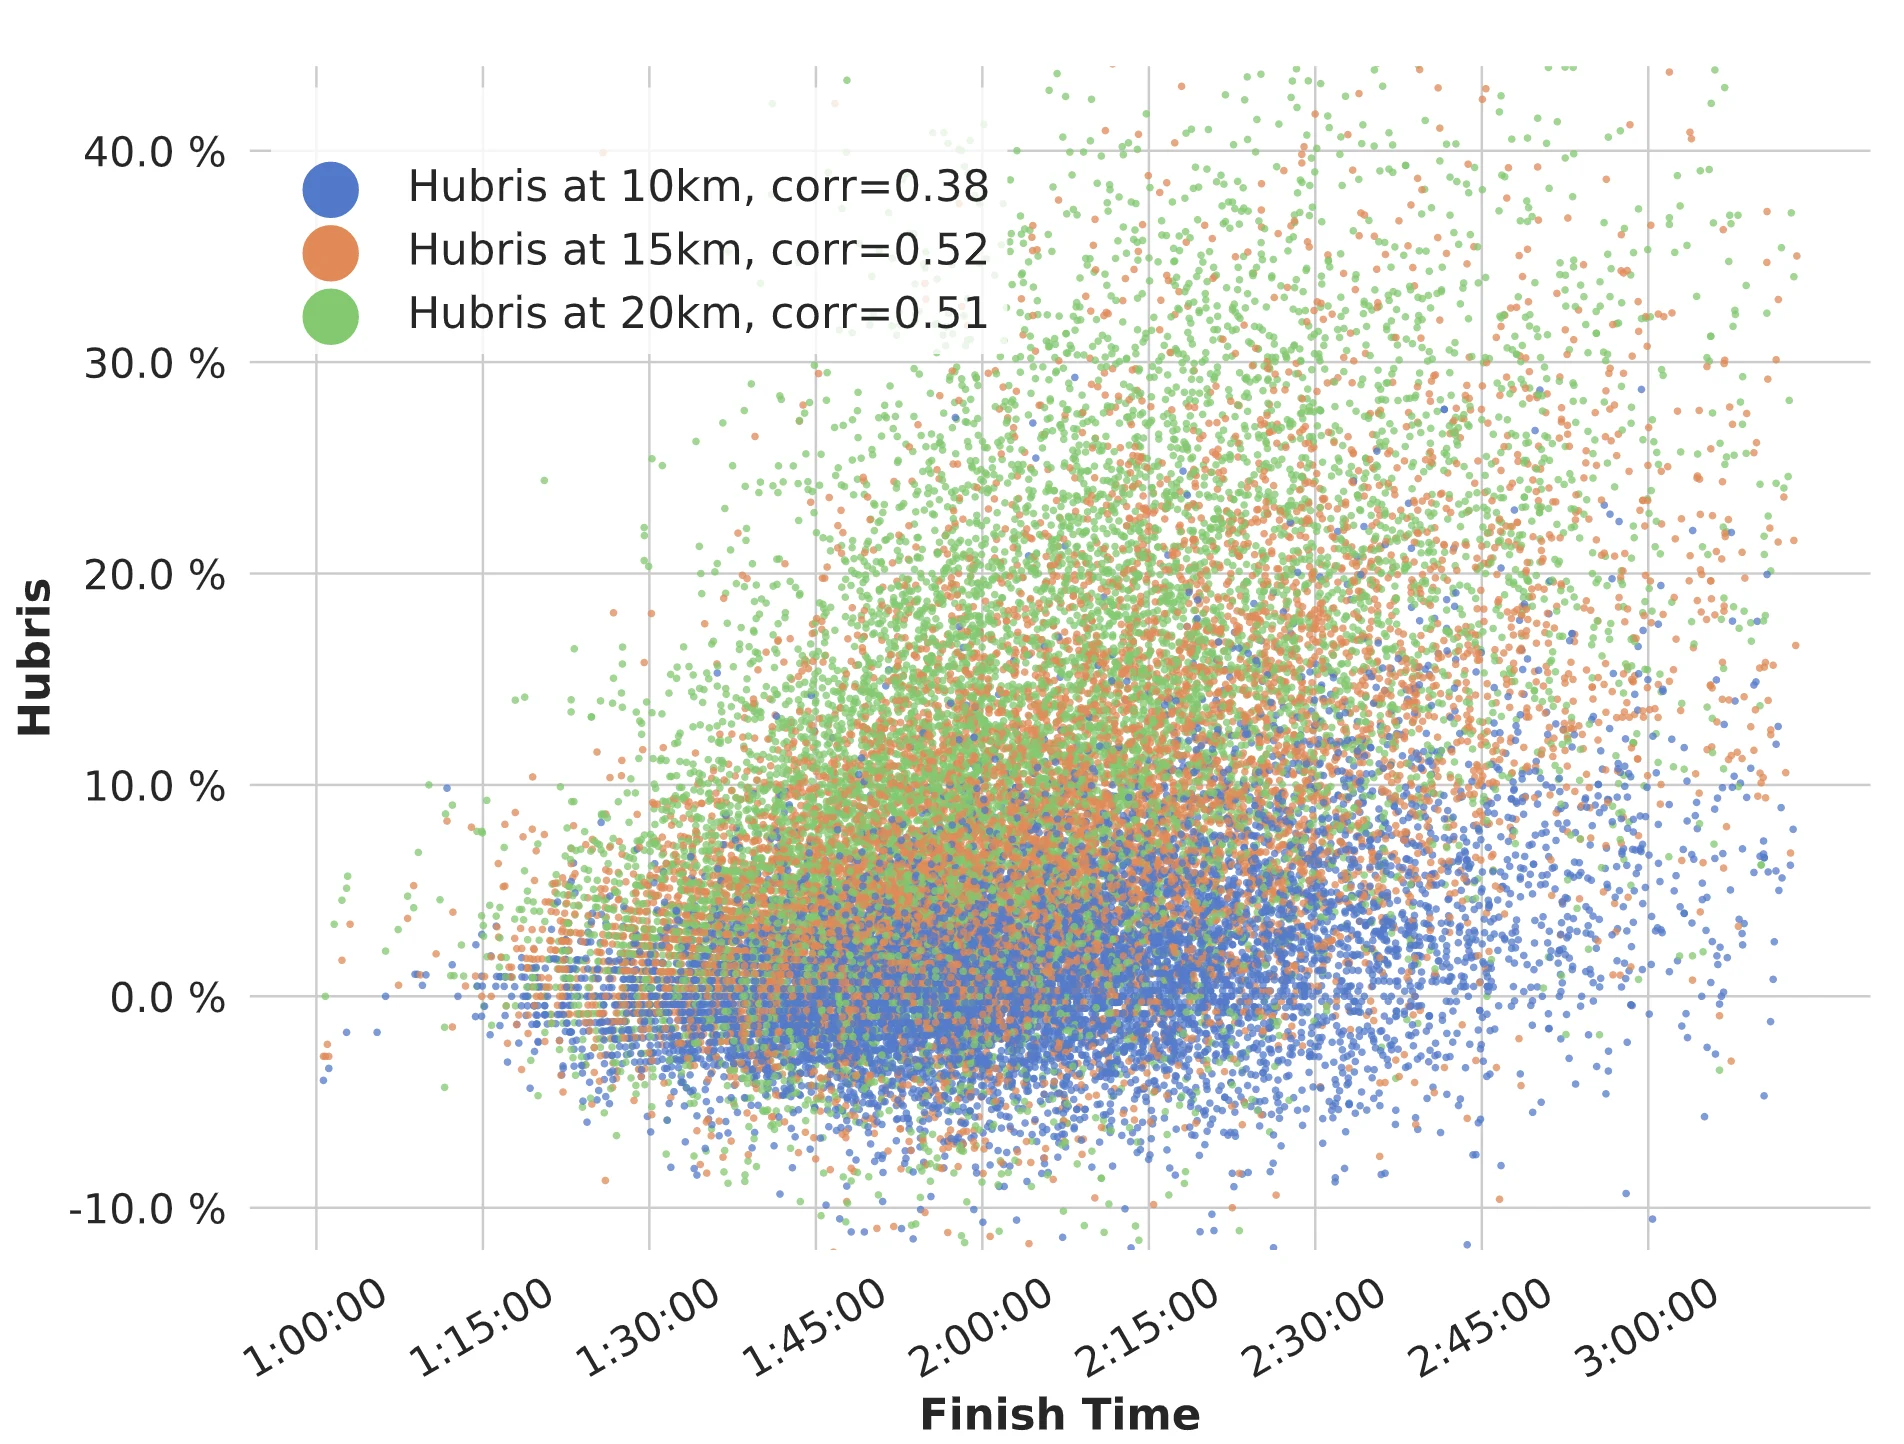 Hubris versus Finish Time for sampled points (30 000). Legend shows correlation to finish time.
In a real world scenario, we don't know anything about the runner's pace until he/she has passed a checkpoint. Let's say a runner had a pace between 10 and 15 kilometers that was equal to the pace of the first leg (5km). While we don't know anything about that runner's performance for the rest of the race, statistics tell us that on average, this runner will have a better finishing time than other runners.
Features with deeper meaning
It is relatively straight forward to estimate a runner's finish time based on mean finishing times for their age and start group. The problem with this is you predict all runners in the same age and start group to the same finish time. Hence, this is not what we are going to do.
Instead, we'll create a machine learning model that focuses on the individual runner. Features for this model can be conceptualized into two groups: general & specific features.
A general feature is for example a runner's gender, age, start group or pace of the first leg. For me, these values would be:
Gender: Male
Age: 28
Start Group: 5
Pace (5km): 4 min 40s
A specific feature is for example a runner's hubris after 10 kilometers, relative to the hubris of other runners. What's powerful with specific features is that we can fold them into any bucket type - we can have hubris relative to age group, or start group, or both. As an example, lets look at my hubris relative to my age group, start group, gender, and combination of start group and age group:
 Absolute difference in percentage points for Oskar versus the four different example buckets. Oskar had lower hubris than other runners similar to himself. This makes it more likely that Oskar has a shorter finish time than the average of similar runners. Yay!
In part 1, we looked mostly at general features, while this part should give you an idea of specific features. Specific features enrich our data with much more information than we had previously. The machine learning algorithm can leverage this additional data during training to build a more accurate model.
What are those features for?
Imagine we have a few points in multi-dimensional space, where every dimension except one represents a feature. The last dimension represents our target prediction - finish time. Every point corresponds to its coordinates in the space, and thus a point is a representation of its values for all possible features. This is our training data. We can fit a model against the points (could be a multi-dimensional function), and use the resulting model for predictions on new, unseen data that we know the feature values for.
This is all hard to think about in more than three dimensions, so here's an example in two dimensions - using start group as our feature, and finish time as our target value:
Simple example model - Start Group
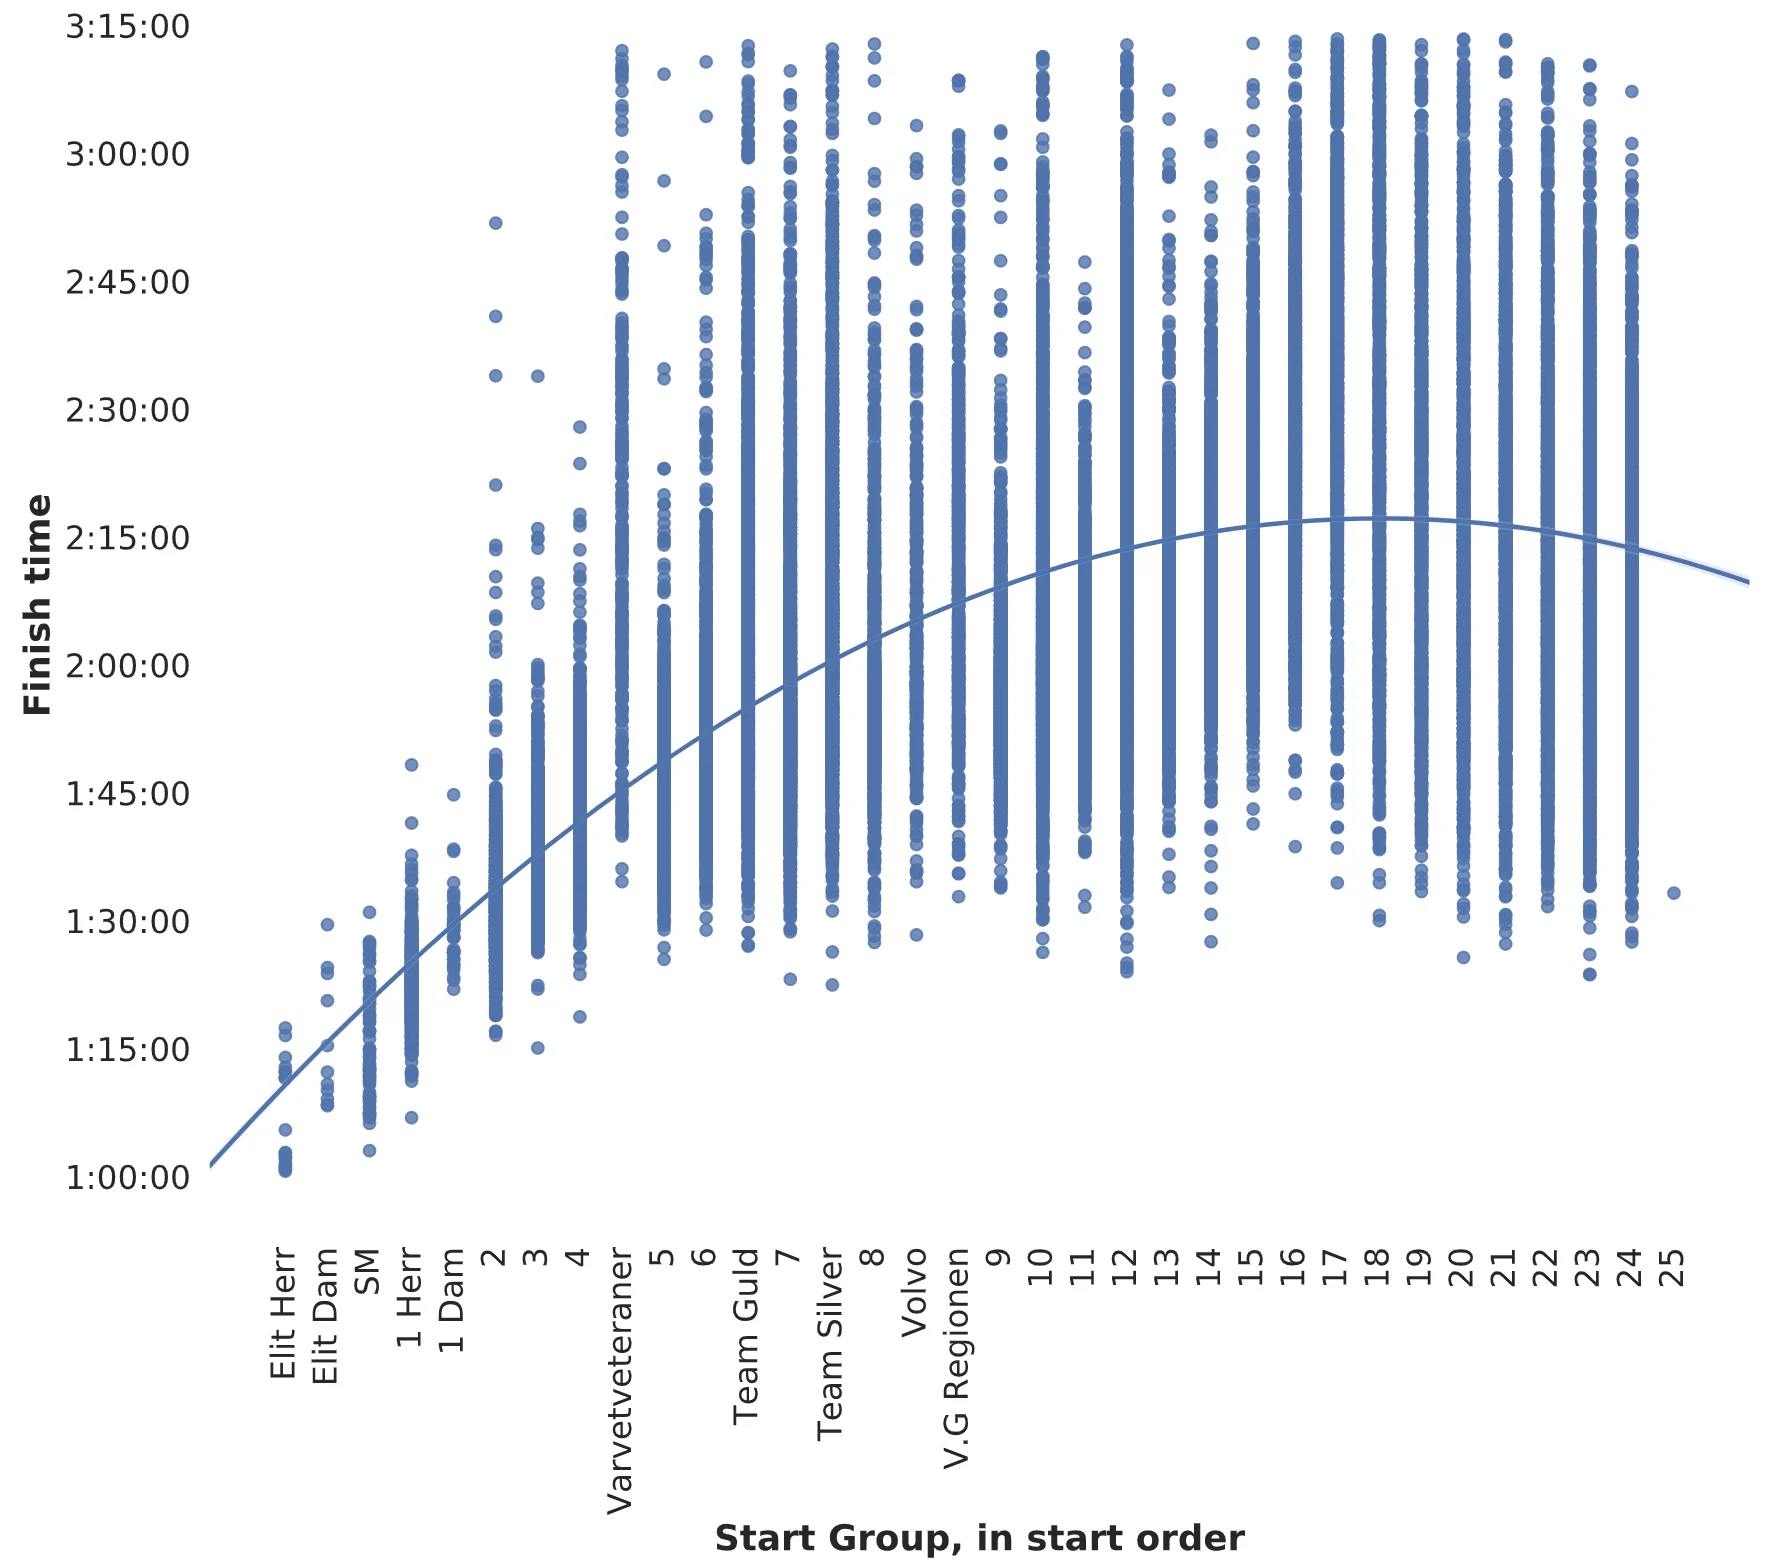 Fitting a simple model (second order polynomial) with a single feature 'start group', against the target variable finish time.
This model won't do a very good job. In order to get better predictions, it needs either a better algorithm to fit against the points, more examples to learn from, or additional features. Changing the function we used is not going to help a great deal since the variance for each start group is high. What we can do is add more features - dimensions - and use similar algorithms (but in higher dimensions).
Luckily, we now happen to have a high number of features, our general and our specific features, that we can put in multidimensional space and fit a model to.
An interesting challenge reveals itself when you consider that you need to perform the predictions in a live, realistic life scenario: We can't use specific features until the runner has started running. Hence, the pre-race prediction will have to be based on general features only. Specific features can be used as the runner progresses through the race, and will greatly improve the finish time prediction.
Next up is part 3 which includes model training, performance analysis and a few example predictions. The model manages to predict my finish time within 30 seconds before the race even started (general features only), and gets better as the race progresses (when it can include specific features).
Published on November 15th 2019
Last updated on March 1st 2023, 11:02

Oskar Handmark
Founder & Venture lead